Dashboard History: From Simple Planks to Strategic Tools
Dashboards began with muddy carriage boards and evolved to today’s modern KPI screens – two centuries striving towards more clarity at a glance.


Welcome to the next stop in our Datavistory series! Today we’ll talk about the fascinating history of dashboards. Picture a wooden plank on a horse-drawn carriage, shielding the driver from flying mud. Now picture a crisp browser tab with KPIs, sparklines, and filters. Same word. Same mission. Less mud.
This is the story of dashboards – the tools leaders built to see what matters and to help them steer faster. From paper stacks to real-time streams, we’ll ride through each era with Joe as our guide. Say hello to Joe, please.
Mud, Hooves, and Benz Patent-Motorwagen
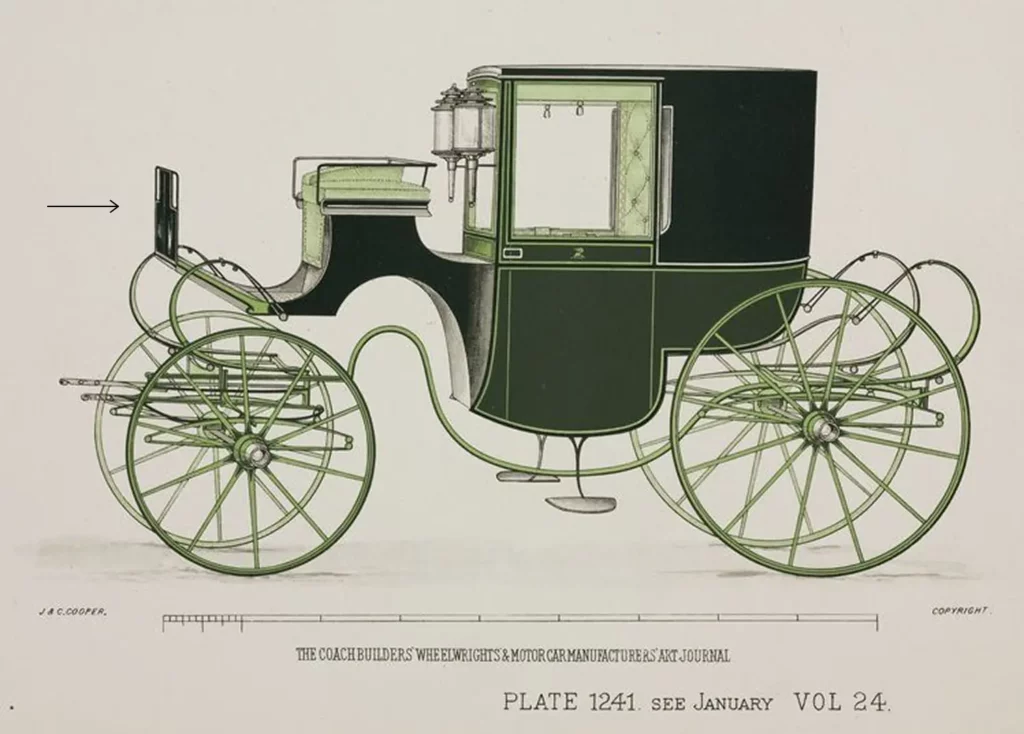
Joe holds the reins. Mud flies. A wooden dash-board – a thick plank fixed across the front of the carriage – stops the mess. It’s set at a slight angle to deflect the mud, stones, and snow kicked up by the horses. On rough roads, this board is the driver’s shield. No windshield. No glass. Just wood (sometimes leather) catching the spray. Drivers lash lanterns or small tools to it, but its main job is simple: keep the line of sight clear so the journey stays safe.
Years later, Joe sits in an early car. In front of him is a plain dashboard – now a panel for instruments. A few needles: speed, oil pressure, maybe an ammeter to show the battery is charging. A couple of switches: ignition, lights, and a choke pull for cold starts. That’s it. No screens, no clutter. The road is loud and bumpy, so the panel must be quick to read. One glance tells Joe the engine is running, the oil is flowing, and the speed is under control. One place to look. Quick read. Quick action.

That simple idea – look → decide → act – will later move into software.
Files Heavy Packet – Management Information Systems
Joe straightens his tie. It’s the 1960s, and the office smells of ink and paper. Behind a glass wall, mainframes roar – giant machines gulping punch cards and spitting out results. Printers hum all day, feeding out thick stacks of paper reports.
On his desk, Joe flips through a heavy MIS packet – Management Information Systems in action. Finance, sales, operations – each reduced to neat tables and summaries. No screens, no instant updates. Just monthly digests, bound and delivered like clockwork.
It isn’t fast. It isn’t interactive. But it is new: for the first time, leaders see the whole business in one place. Centralized. Concise. Cross-functional. The seed of the dashboard is there – only the glowing screen hasn’t arrived yet.
Minimalistic retro bar charts are a reminder of the Management Information Systems (MIS) era.
The First Computer Dashboards – Executive Information Systems
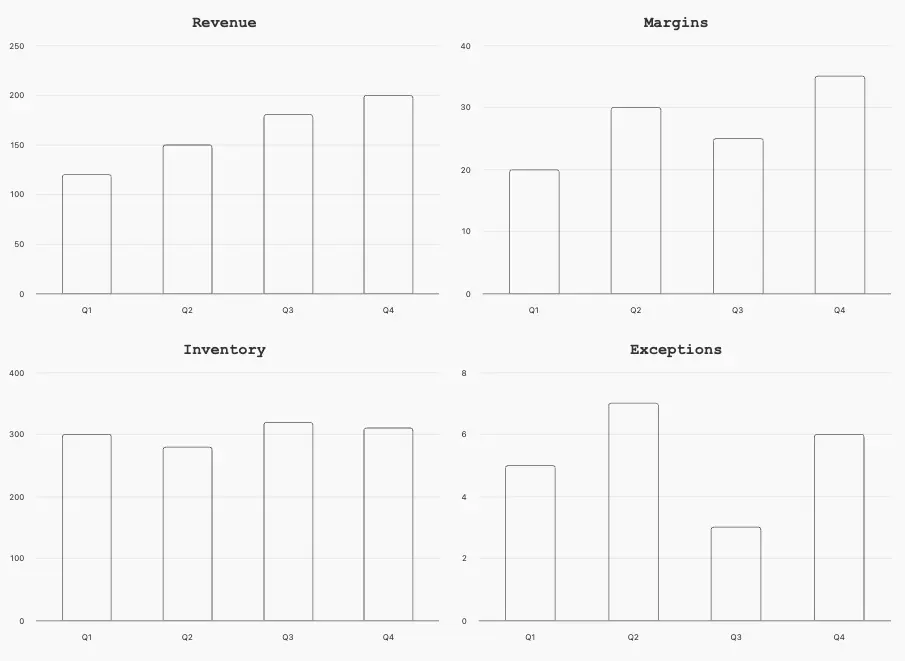
Joe adjusts his suit jacket and his kipper tie. It’s the late 1970s, and the boardroom now comes with a green-screen terminal. On it, one clean page: revenue, margins, inventory, exceptions. No scrolling, no clutter – just the essentials.
This is the rise of Executive Information Systems (EIS). For leaders like Joe, it’s a game-changer. Want to know why revenue dipped? A tap of the function key drills deeper – no binders, no waiting for next month’s report.
EIS isn’t flashy. No fancy charts or colorful gauges. But it delivers something new: fast oversight at a glance. For the first time, business data feels like the control panel of a car – steady numbers, quick reads, and the comfort of control.
Strategy on Screen – Balanced Scorecard
Joe leans over a whiteboard in the 1990s. Markers squeak as he draws four big boxes: Financial, Customer, Internal Process, Learning & Growth. Around the table, managers nod – this is the new language of the Balanced Scorecard.
For Joe, it feels different from the Executive Information Systems he used a decade earlier. EIS gave him fast access to numbers already chosen – revenue, margins, inventory. Helpful, yes, but mostly about the current state. Balanced Scorecard shifts the focus. It doesn’t just say what happened – it says what we should care about and why.
Now, every metric has a home: objectives link to measures, measures tie to targets, targets drive initiatives. No more random dashboards stuffed with vanity stats. They can be considered as a dataviz tool that evolves from status snapshots into strategy maps.
The difference is sharp: EIS told Joe where the business was. The Balanced Scorecard tells him where the business needs to go.
The Beginnings of the Business Intelligence Era
It’s the early 2000s, and Joe starts his day by opening a web browser. No more binders, no more terminals, just a clean homepage of KPIs. Tools like Cognos and Hyperion now put dashboards in the hands of entire teams, not just executives.
But along with the hype comes confusion. What even counts as a dashboard? Practitioners step in with a few ground rules:
- One screen
- Only the most important information
- At a glance
Joe likes the clarity. Gone are the giant gauges and “speedometer” lookalikes. In their place: compact charts, sparklines, and small multiples. Dashboards shift from decoration to decision tools, giving every team a common starting point for Monday meetings.
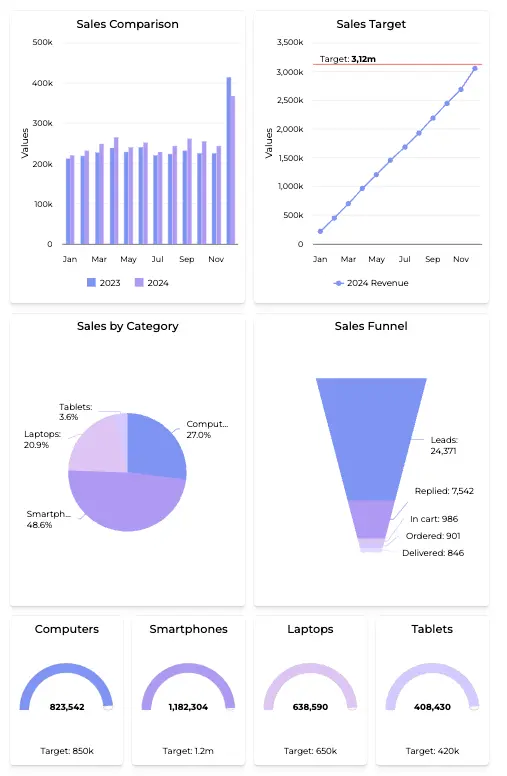
A modern dashboard that can help the sales department navigate the tricky decision-making process.
Present Times
Fast forward. Joe’s phone buzzes – an alert from a dashboard. A key metric just slipped. He taps the screen and sees it all: what changed, why it matters, and where to dig deeper. One click takes him to a notebook with the root cause. Another lets him assign the issue to a teammate.
Today’s dashboards aren’t just watchtowers; they’re watchtower + workbench. They monitor in real time, but they also guide action. And they’re no longer just for executives. Product managers, engineers, finance teams, ops, and marketers all use them daily.
For Joe, the idea hasn’t changed since the muddy carriage plank: see fast, act fast, avoid the flying mud. But now the whole company rides alongside him.
The Bottom Line
Dashboards didn’t start with pixels – they started with purpose. Joe’s carriage board kept mud out of his eyes. His car panel kept the engine in check. His EIS screen kept revenue and margins in view. Today’s dashboards keep whole teams aligned in real time.
The tools might have changed – wood, needles, green text, glowing charts – but the mission stays the same: one screen, clear signal, quicker decisions.
From mud to metrics, that’s the journey of the dashboard.